


Recent History
January 3, 1923
Elliott P. Joslin
The Treatment of Diabetes Mellitus

Joslin's food values important to the treatment of diabetes lists many zerocarb foods such as meat, chicken, bacon, cheese, butter, oil, fish, and broth. He jokes later that it is impractible to show carb counts in other foods because they're effectively banned.
"Caloric Values which Every Doctor Should Know by Heart.
The quantity of carbohydrate, protein and fat found in an ordinary diet must be known by a physician if he wishes to treat a case of diabetes successfully. If he cannot calculate the diet he will lose the respect of his patient. The value of the different foods in the diet can be calculated easily from the diet Table 165. This is purposely simple, because a diet chart, to be useful, must be easily remembered . With these food values as a basis it is possible to give a rough estimate of the value and composition of almost any food . Various foods are also classified according to the content of carbohydrate (see p.435) in 5, 10, 15 and 20 per cent groups, and the lists are so arranged that those first in each group contain the least, those at the end the most . This is a practical and sufficiently accurate arrangement , because except in the most exact experiments the errors in the preparation of the food are too great to warrant closer reckoning. It is practically impossible , except when accurate analyses of the diet are made , to reckon the car bohydrate for the twenty - four hours closer than within 5 to 10 grams , and we had best acknowledge that fact . It is really surprising , however , how reliable the figures are if we do not push the matter to extremes . For example, the protein was analyzed in 10 portions of cooked lean meat, similar to 10 other portions served the same day at the New England Deaconess Hospital. In these analyses it was found that the protein content was 30 per cent .
Repeatedly physicians have requested me to arrange the above table in terms of household measures. To a considerable extent this is impracticable because the diabetic diet deals with so small a quantity of carbohydrate."
February 9, 1924
Hypoglycemic symptoms provoked by repeated glucose ingestion in a case of renal diabetes by R.B. Gibson, Ph.D and R.N. Larimer, M.D., Iowa City
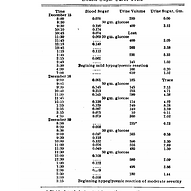
Hypoglycemic symptoms provoked by repeated glucose ingestion in a case of renal diabetes - A case study of using repeated bouts of 50 grams of carbs shows the danger of hypoglycemia "consisting of burning and flushing of the face, weakness, tremor and sweating. The second shock was the more severe of the two."
HYPOGLYCEMIC SYMPTOMS PROVOKED BY REPEATED GLUCOSE INGESTION IN A CASE OF RENAL DIABETES R. B. Gibson, Ph.D., and R. N. Larimer, M.D., Iowa City
One of us (R. B. G.), in November last, reviewed the chemical findings in a case from our diabetic clinic before the Iowa Clinical Medical Society. Interest in the case centered in the fact that a final diagnosis of what was otherwise a case of pronounced renal diabetes could not be made because the sugar curve indicated a deficient glycogenesis of the mildly diabetic type. A study of the effects of a repeated ingestion of glucose on the sugar curve by Hamman and Hirschman was recalled, and we predicted in our report that a decisive differentiation might be obtained if we employed the double sugar curve test in this case. The patient was requested to return for further observation, and promised to come to the clinic in January of this year.
We have in the clinic, at the present time, a second patient with a fasting hypoglycemia and a glycosuria of long standing which does not respond to diabetic management. The data presented in this communication were obtained in this case. Glycogenesis is stimulated by glucose ingestion, as is indicated by the rapid fall of the blood sugar from the peak of the curve (usually forty-five minutes) to a figure at the end of two hours almost always less than the fasting control observation. A second administration of glucose brings about a yet more rapid removal of sugar from the blood stream and a consequent lowering of the sugar curve. The desugarized diabetic patient may show an effect similar to the normal person, but of much less degree (one case, Hamman and Hirschman). When tried in our case, the effect of the double sugar curve test was so great that hypoglycemic symptoms were observed in two out of three trials.
REPORT OF CASE Mrs. B., aged 30, white, weight 110 pounds (50 kg.) (best weight 115 pounds [52 kg.] ten years ago) was admitted to the hospital with a history of glycosuria of ten years' standing. This had been discovered by a urine examination during the first of her two pregnancies. She had never had other symptoms of diabetes except for some pruritus seven years ago; she had dieted off and on since that time. The condition seemed to be familial, the patient stating that she had one sister surely and one probably glycosuric patients without other symptoms; however, she had no knowledge of glycosuria in either of her parents. The patient was placed on a diet of 50 gm. of protein, 50 gm. of carbohydrate, and 125 gm. of fat; on this, she excreted from 4.5 to 8.5 gm. of glucose daily. Her blood uric acid was 3 mg., and blood urea nitrogen, 18 mg. Fasting blood sugar determinations or figures obtained two hours after meals were always hypoglycemic. The results of our tests with the double sugar curve are given in the accompanying table.
Definite hypoglycemic symptoms were obtained in the first and third trials; they were identical with the several mild insulin reactions which we have observed in our diabetic patients, consisting of burning and flushing of the face, weakness, tremor and sweating. The second shock was the more severe of the two; the patient was completely relieved in fifteen minutes when given 100 c.c. of orange juice. The lowering of the leyel of the entire curve in the third trial is in accord with the experience that glycogenic effects may become more pronounced if the ordinary procedure is repeated without a sufficient number of days elapsing between tests. When questioned as to the occurrence of similar attacks at home, the patient stated that she had experienced such of milder degree, but could not associate these with any definite circumstance. One sister had like attacks. It seems likely that hypoglycemic symptoms not artificially produced are a definite clinical entity.
In explanation of a diminished glycogenesis in pronounced renal diabetes, it was stated, in the paper referred to above, that "It is quite possible that glycogenesis in our case may be functionally diminished because of the rapid removal of glucose through the kidneys; if so, repeated administration of glucose might so stimulate the glycogenic power fhat a normal or subnormal sugar curve will result." Since this report was submitted for publication, threshold hypoglycemic symptoms with a blood sugar of 0.045 per cent, have been induced in our first patient; the maximum hypoglycemic effect is quite transient.
December 1, 1927
Dietary Factors that Influence the Dextrose Tolerance test - A preliminary study - by J. Shirley Sweeney, M.D.

Sweeney studies healthy young people to see how feeding them a certain macronutrient influences the results of a glucose tolerance test, and proves that carbohydrates sensitize the body to future carbohydrates, while fat and starving create an insulin resistance effect where blood sugar stays high after a sudden assault of glucose.
The current explanation of this phenomenon (Macleod) is that the first dose of glucose sensitizes the insulin-secreting mechanism, so that in response to the second dose the islet cells secrete insulin more readily and more abundantly at a lower level of hyperglycaemia. On the basis of this explanation Sweeney, in 1927, attempted to explain the variations in sugar tolerance found in normal subjects on different diets. Using the ordinary glucose tolerance test as a guide, he investigated the sugar tolerance of healthy individuals during starvation, on a fat diet, on a protein diet, and on a carbohydrate diet. He found that protein had little effect; that fat diets and starvation diminished sugar tolerance; and that carbohydrate diets improved sugar tolerance. Sweeney considered that the diminished sugar tolerance was due to the impaired sensitivity of the insulin-secreting apparatus, consequent upon the absence of the stimulus of carbohydrate ingestion, and that the improved tolerance was the result of the increased sensitivity of this mechanism, owing to greater stimulation.
https://www.ncbi.nlm.nih.gov/pmc/articles/PMC2444943/pdf/brmedj07161-0009.pdf
December 1927
DIETARY FACTORS THAT INFLUENCE THE DEXTROSE TOLERANCE TEST - A PRELIMINARY STUDY
Abstract
The dextrose tolerance test is now being extensively employed as a diagnostic procedure. It is most beneficially used in the differentiation of mild diabetes mellitus and renal diabetes. It is also being used, and is believed to be of diagnostic value, in many pathologic conditions, such as encephalitis, malignant tumor, pituitary and thyroid dysfunctions and nephritis.
Although it is definitely established as a diagnostic procedure, there is some diversity of opinion concerning what constitutes a normal response to the oral administration of dextrose. Some writers state that in a healthy person there may be a postprandial rise in blood sugar of from 14 to 16 per cent and a return to the normal within two hours. There are other writers who consider a postprandial hyperglycemia of 20 per cent within normal limits. It is generally believed that the persistence of the postprandial hyperglycemia is of more diagnostic significance than the degree of hyperglycemia. In early cases of diabetes the blood sugar curve rises higher, stays up for a longer time and does not return to normal for several hours. Macleod says that "slight deviations from the normal must not be given too much weight in diagnosis, since they may occur in other diseases or even in perfectly normal persons." All who have studied dextrose tolerance curves have noted the variability exhibited by normal persons, to say nothing of those who are diseased. These variations have been discussed and explained in different ways.
It occurred to me that perhaps the character of the food and the amount of water that a person had been consuming for a few days prior to the time the tolerance test was made might be factors that would influence the dextrose tolerance curve. If these factors should prove to be capable of altering a tolerance curve, they could be controlled. This would eliminate some of the confusing variability that is so frequently observed. It was these thoughts that lead to the following experiments.
Young, healthy, male medical students were used to study the effect of different preceding diets. Four groups were formed. The subjects in one group were given a protein diet, those in another a fat diet, those in a third a rich carbohydrate diet, and those in the fourth group were not given any food—the starvation group. Those on the protein diet received only lean meat and the whites of eggs. The students on the fat diet received only olive oil, butter, mayonnaise made with egg yolk, and 20 per cent cream. Those in the group fed on carbohydrates were allowed sugar, candy, pastry, white bread, baked potatoes, syrup, bananas, rice and oatmeal. These diets were followed for two days. Meals were taken at the usual hours, and eating between meals was allowed, provided the diets were followed. Those in the starvation group did without food for two days.
On the morning of the third day, each student was given by mouth 1.75 Gm. of dextrose per kilogram of body weight, on an empty stomach. Determinations of blood sugar were made from samples of venous blood removed immediately before the dextrose was given, and at 30, 60 and 120 minute intervals following its administration. I made all determinations of blood sugar by the Folin-Wu method.
A better comparison of these groups is obtained by examining table 5 and chart 5 in which are contained the average or type curves of each group. It will be noted that those students who were on the carbohydrate diet exhibited a marked increase in sugar tolerance and those on a protein diet a slight decrease in tolerance, while those who were placed on the fat diet and those who were starved manifested a definite decrease in sugar tolerance. The differences in the average fasting blood sugars are noteworthy. The blood sugar in those of the protein and starvation groups was distinctly lower than that of the members of the fat and carbohydrate groups.
Because of the great difference in these groups, those students on the fat diet and those in the starvation group who showed the most extreme responses were placed on the carbohydrate diet. Similiarly, those in the carbohydrate group who showed an extreme response were placed on starvation restriction. This was obviously done to determine whether the curve of a person could be changed significantly by diet. The results are presented in table 6 and in charts 6 and 7.
Comparison of the curves of these five students is striking. The curves of all who had been placed on carbohydrate diets manifested a definite increase in their sugar tolerance. When three of these (the three most extreme) were placed on starvation restrictions, the curves were notably abnormal ; there was a marked postprandial hyperglycemia. which persisted at the end of two hours ; in other words, what was an increased sugar tolerance following the carbohydrate diet became a definitely decreased tolerance following two days of starvation. The remaining two persons who were placed on the fat diet showed a similar decreased tolerance. It should be stated that an interval of at least one week was allowed between the tolerance tests performed on the same subject.
January 1, 1928
Diet, delusion and diabetes

Dr Sansum increases the carb content in his Type 1 Diabetics to 245 grams per day because it was shown that a high carb diet improved glucose tolerance (but not risk of disease).
Physicians were slow to appreciate that insulin allowed the proportion of carbohydrate in the diet to be increased, for, as Himsworth said, ‘a well-founded theory directs that the carbohydrates in the diabetic’s diet must be curtailed if health is to be preserved’. On the other hand, as he continued, ‘a brilliant piece of clinical empiricism produces irrefutable proof that a liberal allowance of carbohydrate acts favourably on the diabetic’s health’ [17]. This empiricism began in 1926, when a high carbohydrate diet was first shown to improve glucose tolerance in healthy individuals [18]. Noting this, William Sansum promptly increased the carbohydrate content of the diet of his Californian patients; a typical recommendation might include 2,435 calories, 245 g of carbohydrate (40% of energy requirements), 124 g of fat and 100 g of protein [19].
January 1, 1933
Clinical Diabetes Mellitus and Hyperinsulinism.

“The absence of complaints of hunger has been remarkable,” the Mayo Clinic’s Russell Wilder wrote in 1933 when using a ketogenic meat-based diet for his patients.
Considering these tiny numbers, let’s try changing our perspective and rephrasing the question. Rather than ask why some of us get excessively fat, what with all the copious food and drink we have available, perhaps the question should be why all of us don’t. It’s one thing to err on the side of undereating and go a little bit hungry all the time, but most of us don’t. We eat to satiety. So why don’t we all get fat? Certainly animals don’t walk away from their plates hungry. Why don’t they all get fat?
Russell Wilder, the leading pre–World War II authority on obesity and diabetes at the Mayo Clinic, did ask precisely this question in 1930: “Why then do we not all grow fat?” After all, he wrote, “we continue to be protected against obesity, most of us, even though we hoodwink our appetite by various tricks, such as cocktails and wines with our meals. The whole artistry of cookery, in fact, is developed with the prime object of inducing us to eat more than we ought.” (That was almost ninety years ago when Wilder said “most of us” are protected against obesity. Today he might have to say “some of us,” but his point is still a good one.)
Gary Taubes. The Case for Keto: Rethinking Weight Control and the Science and Practice of Low-Carb/High-Fat Eating (Kindle Locations 792-796). Knopf. Kindle Edition.
At the time Bruch wrote those words, the medical literature was already rife with reports of the remarkable success—what physicians would call the “clinical efficacy”—of diets that restricted these “innocent foodstuffs” and included copious animal products. Physicians working in hospitals and clinics around the world were publishing reports similar to Pennington’s: These unbalanced diets restricted in sugars, grains, and starches, fat-rich instead, induced significant weight loss without hunger. This was the case in report after report, independent of how many calories the patients in these various institutions were fed, whether fewer than five hundred calories a day (as at the Mayo Clinic) or whether the patients were encouraged to eat as many calories as they could, as was often the prescription. “The absence of complaints of hunger has been remarkable,” the Mayo Clinic’s Russell Wilder wrote in 1933.
Gary Taubes. The Case for Keto: Rethinking Weight Control and the Science and Practice of Low-Carb/High-Fat Eating (Kindle Locations 1157-1164). Knopf. Kindle Edition.
Russell M. Wilder: — A Biographical Sketch (November, 1885 – December, 1959)
https://academic.oup.com/jn/article-abstract/74/1/1/4775787?redirectedFrom=PDF
Dr. Wilder's appreciation of the impor tance of nutrition in medicine was indi cated in his chairman's address to the section of Pharmacology and Therapeutics of the American Medical Association in 1930. He stated that although knowledge of nutrition was increasing rapidly in the laboratories of biochemistry and physiol ogy, the medical profession as a whole gave the subject scant attention. He pleaded "for the thoughtful attention of the members of the profession to this important field of therapeutics, for greater intellectual application on the part of practitioners to quantitative features of dietetics and for a greater amount of in struction in nutrition by medical schools." He indicated in his memoirs that "this became my theme song for the balance of my professional career.
Ancient History
Cairo, Cairo Governorate, Egypt
1552
B.C.E.
The Ebers Papyrus is the first known medical reference to diabetes mellitus.
["Diabetes and the Ebers Papyrus"]) by D. Lynn Loriaux, M.D., PhD
"Of great interest to endocrinologists is the opinion that in the Ebers Papyrus is the first known medical reference to diabetes mellitus. The reference is to a single phrase: "...to eliminate urine which is too plentiful."
"Unfortunately, the crucial word, asha, can mean both 'plentiful' and 'often,' and it is unclear whether the condition described was polyuria(increased volume of urine) or increased frequency of micturition, very often due to cystitis. The latter condition is much more common and therefore the more likely interpretation."


